Details, insights, and methodology notes from the Data Golf analytics team.
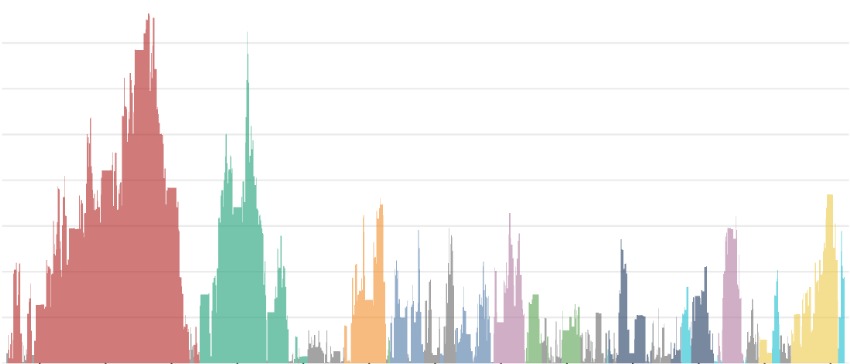
Details and insights from our newly released women's adjusted strokes-gained baselines and ranking methodology — including how the women's model compares structurally to the men's.
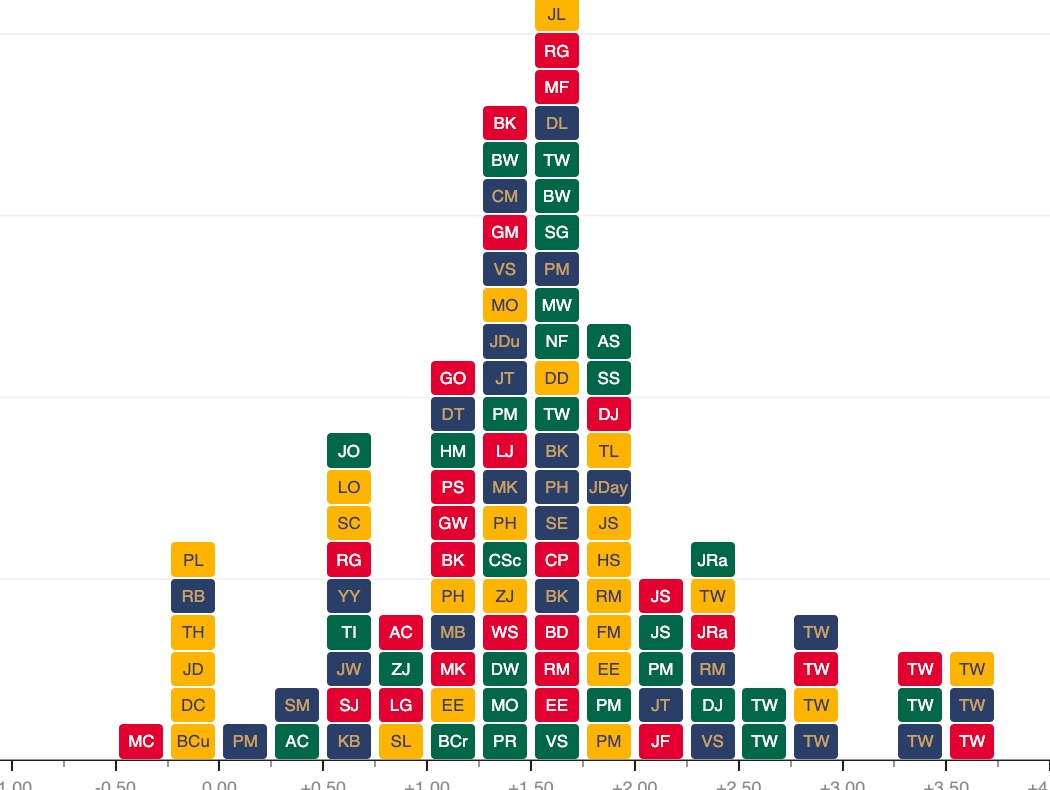
We have integrated PGA TOUR ShotLink coverage for Augusta National going back to 2004. This post explains what the data shows about hole difficulty, approach proximity, and putting surface characteristics at the Masters.
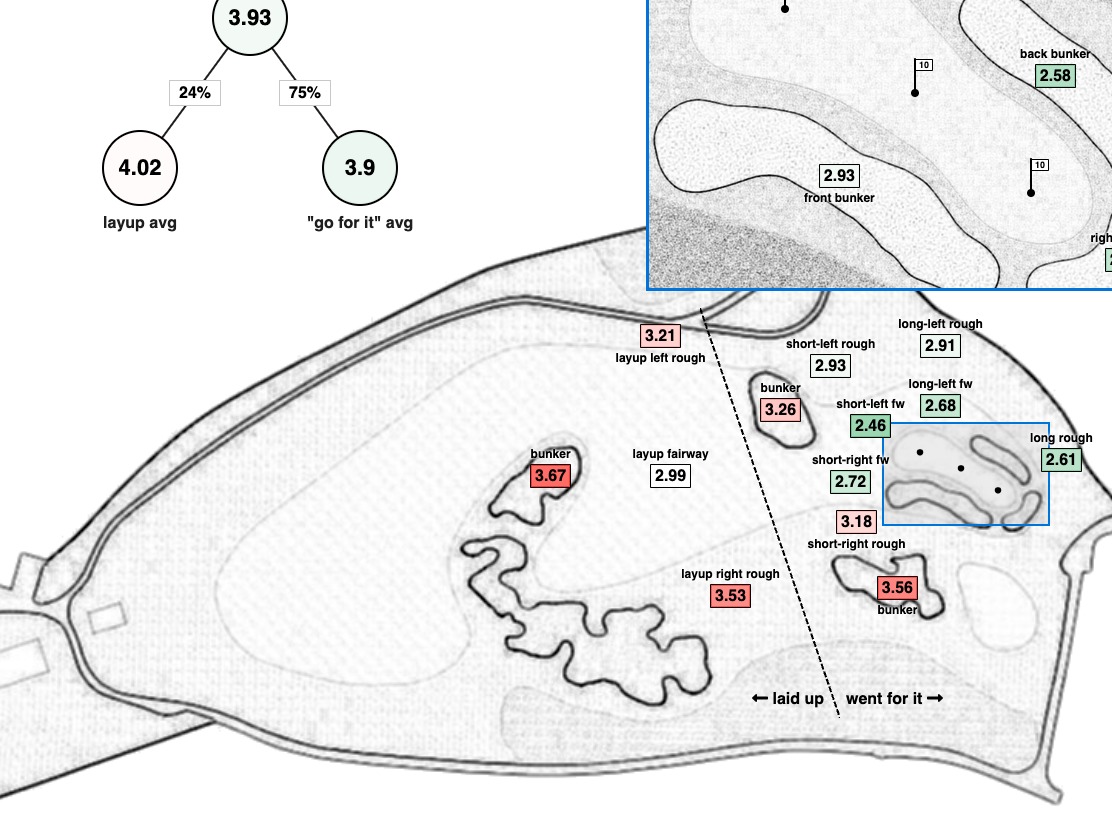
Preparing a simple experiment comparing bookmaker-implied uncertainty, field strength, and round-by-round lead volatility to assess which events consistently produce the tightest finishes.
Using strokes-gained approach data broken down by distance bucket and shot shape, we examine why Thomas's iron game ranks elite even when his overall ranking fluctuates — and what separates his stock yardages from his weaknesses.
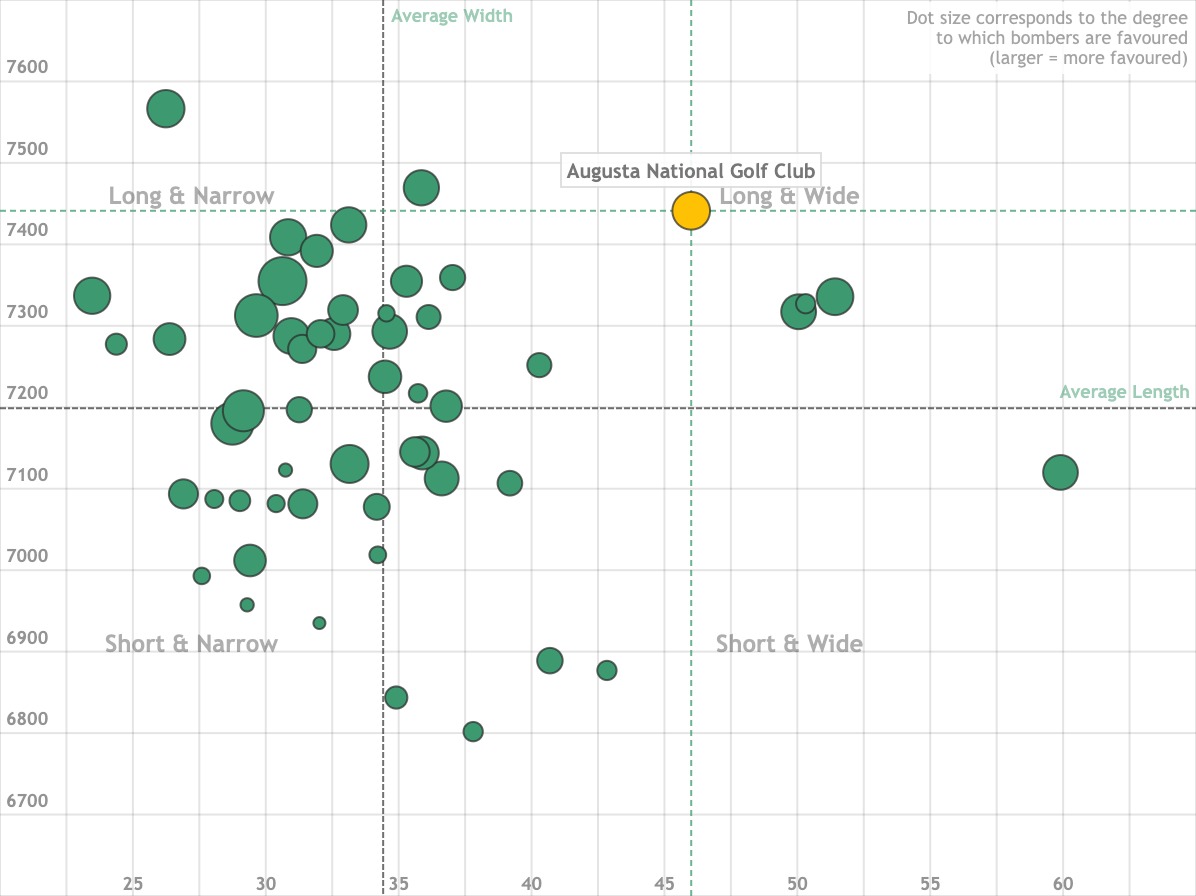
Analysing the impact of hole width characteristics on performance for specific player skill sets — does extra room off the tee genuinely help bombers, or does it equalise competition?
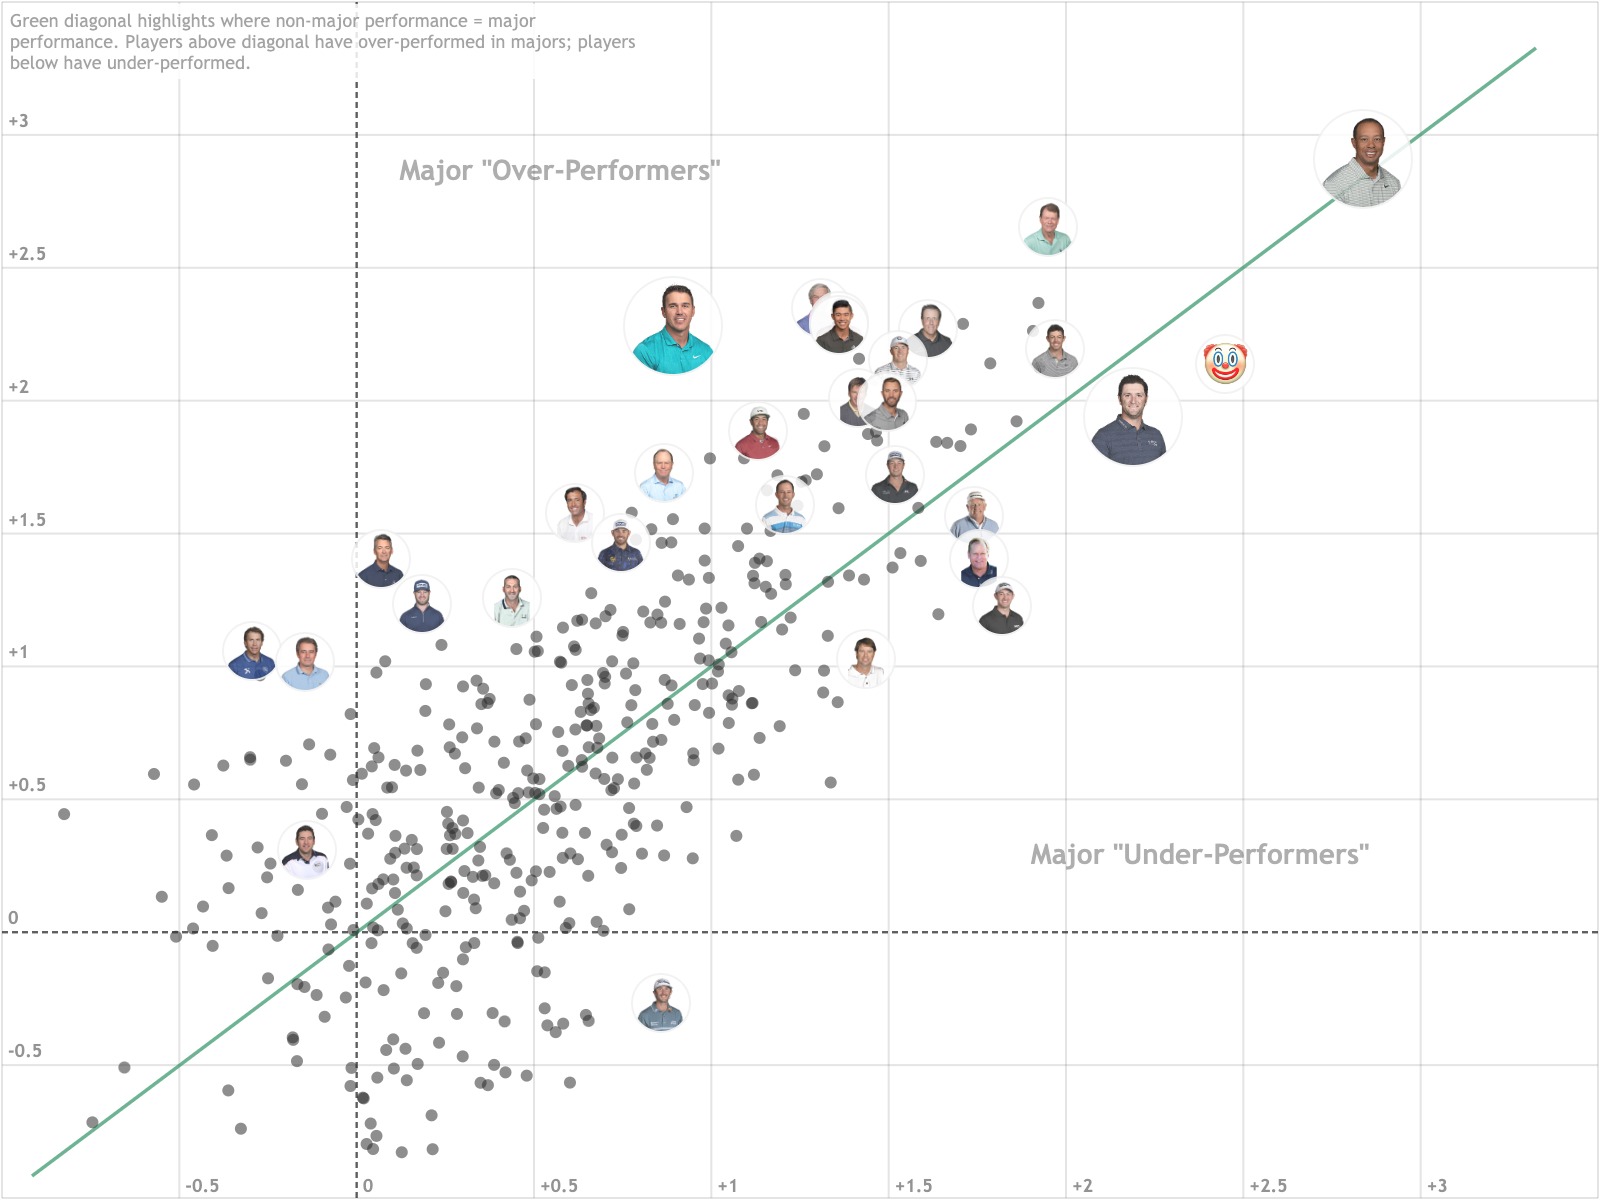
Analysing bookmaker accuracy from 2021-2025: an update to our original study accounting for the effects of shrinkage, market timing, and the increasing influence of sharp money on opening lines.
A walkthrough of the regression framework behind our course-fit module: how player skill profiles are matched against historical performance patterns at each venue, and what goes into the final tournament-adjusted baseline.
A summary of the changes we made to the DG model heading into 2026: updated recency weights, a revised LIV-to-PGA tour conversion, and tweaks to the putting baseline regression.
Strokes-gained putting is the noisiest category. This post visualises how much season-to-season variability exists for the game's top putters and what it implies for pre-tournament predictions.

Interactive charts tracing how each strokes-gained category evolves from rookie year to decline phase for a set of recently retired and active players — illustrating which skills peak early and which age best.
The FedEx Cup points allocation is more nuanced than it appears. We break down the actual mathematical structure behind how points are awarded, why top-10s matter disproportionately, and how the system differs from DG Points.
We compare cut-making rate against conventional skill metrics as a standalone predictor of short-term performance, finding it adds modest but real information especially for lower-ranked players on thin statistical samples.